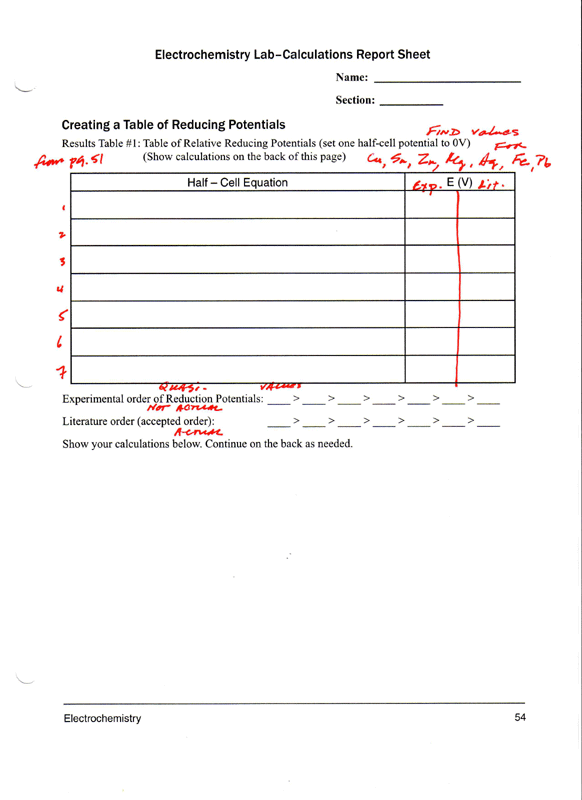
Part 1: Reducing Potentials (Tables #1 and #2)

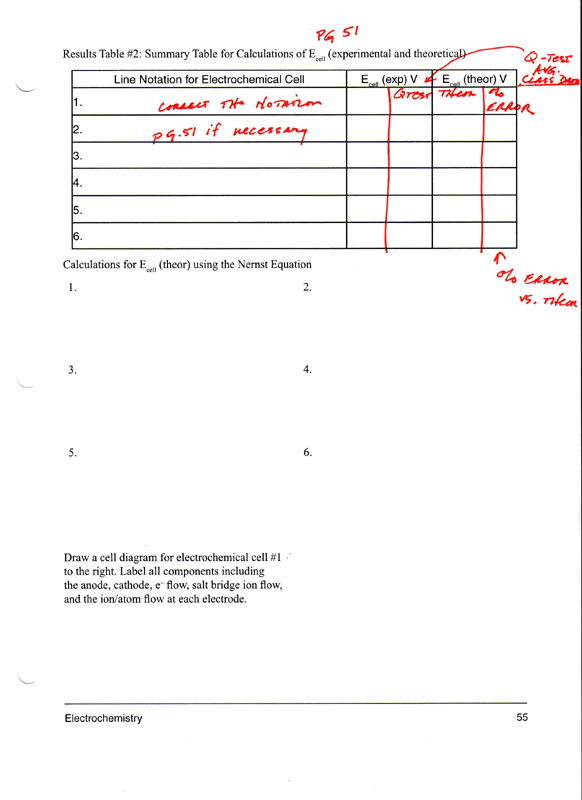
Enter your respective experimental voltages for the cells for Table #2 on the blackboard.
See pp. 123-124 DVC Lab Manual Q Test
Perform the Q Test on your assigned cell's data.
Recalculate the Average. Report on the Blackboard before leaving lab today.
Record the Blackboard averages for all cells in Table #2 pg. 55
Record the literature cell potentials in Table #2 pg. 55
Write the correct cell notation for each cell: E = (+) V
Calculate the % error between the Q-Test adjusted data and the literature value for each cell.
